Financial Roadmap
Ramsey Solutions · EveryDollar · Web
Made long-term financial planning and progress easy to visualize (+$120K revenue impact).
Users struggled to understand how their financial decisions today impacted their long-term goals. I designed a visual roadmap that made progress, tradeoffs, and milestones easy to understand and adjust over time.
The flows of Financial Roadmap on web
The Problem
Users had long term financial goals, but no clear way to see how they connected over time.
Without a clear view of progress or tradeoffs based on their monthly spending, it was difficult to stay motivated or make informed decisions about where to focus.
My Role
SOLE PRODUCT DESIGNER
I was the only designer, working with a PM and our web engineers. Before designing, I reviewed user feedback, partnered with customer success, and interviewed users. In testing, they loved seeing projections beyond their monthly budget, wanted to understand the math behind their net worth, and valued seeing how adding to their extra money each month could speed up paying off debt, saving, or investing. I also designed the mobile V1, which shipped after I left.
WHAT SHIPPED
Introduced a roadmap view to visualize progress over time
Connected goals, milestones, and timelines into a single system
Made tradeoffs visible so users could adjust priorities
Designed for flexibility as plans changed
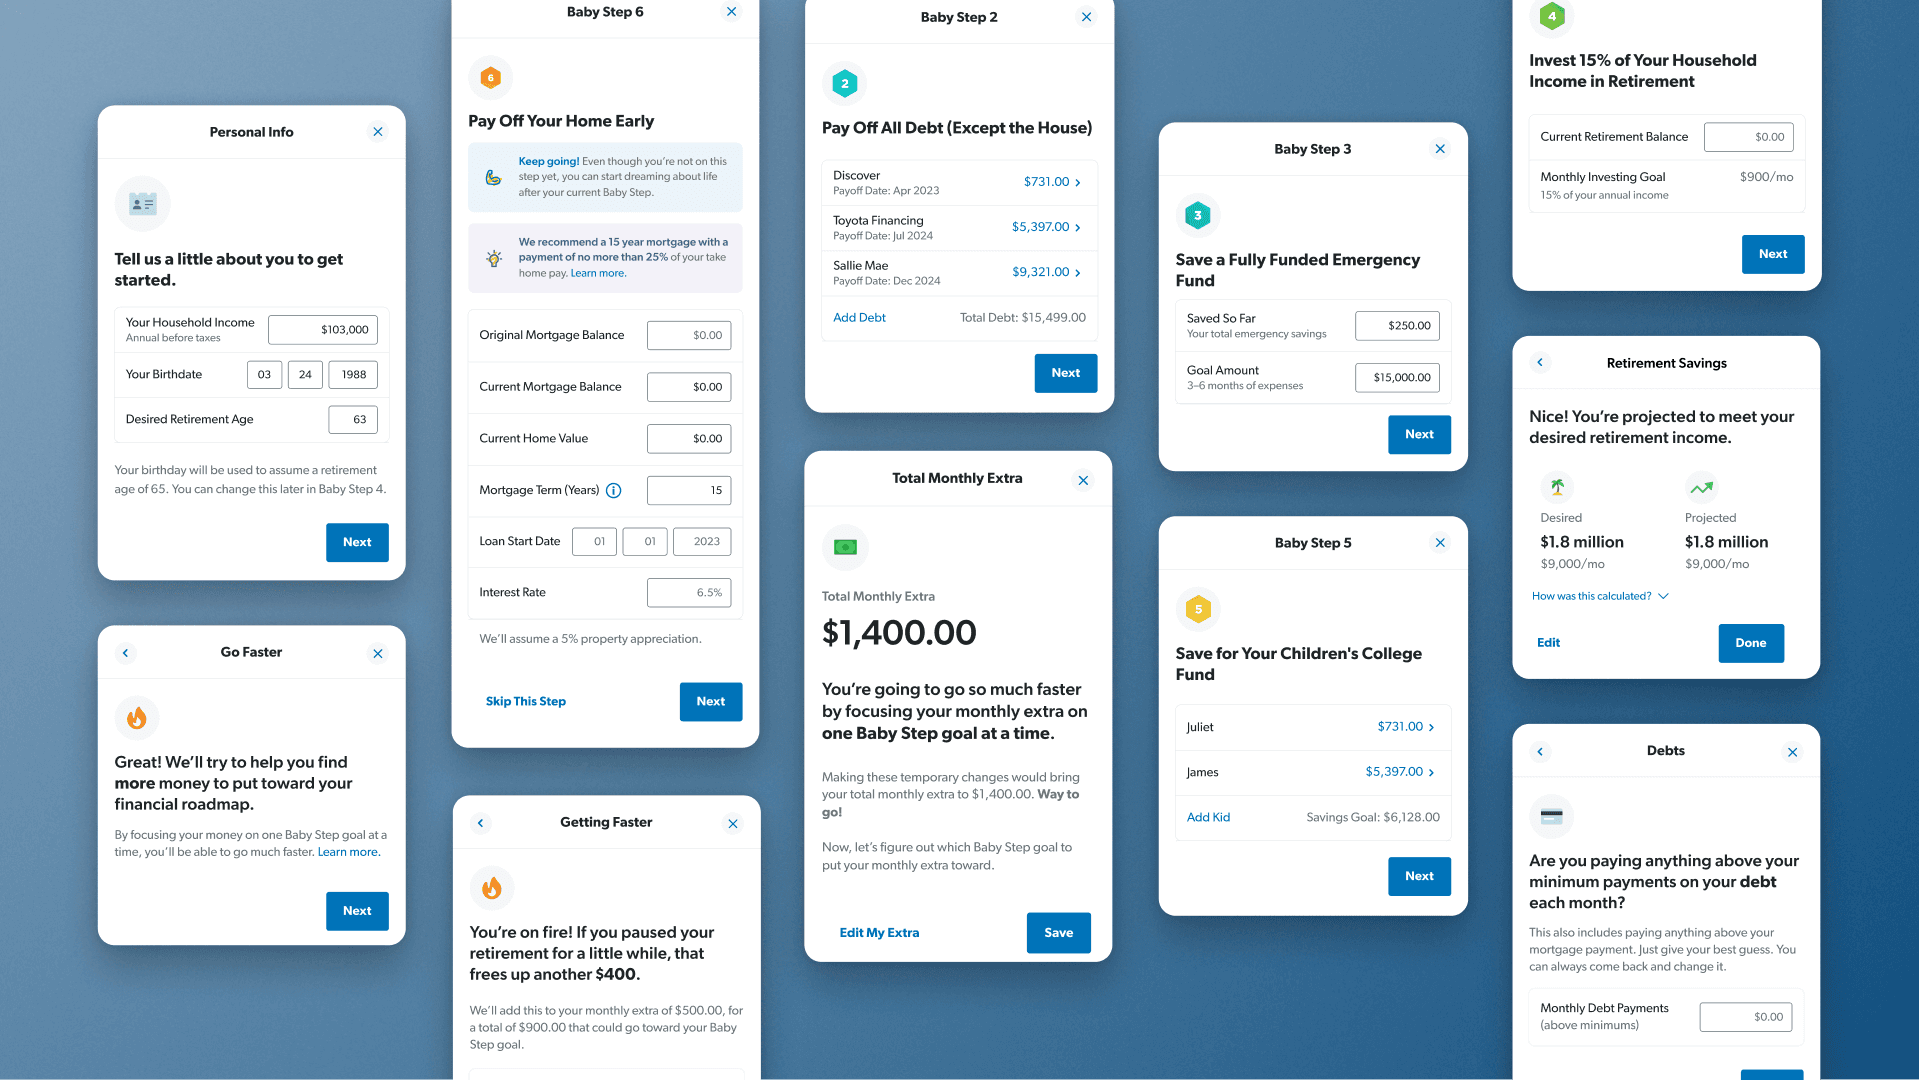
Collected data points in Financial Roadmap
Decisions & Trade-offs
TESTING VALUE BEFORE VISUALS
Before investing in visualization, we signal-tested a dense, numbers-only spreadsheet to see whether users found the data valuable. Once they confirmed it was, I replaced the rows of numbers with a visual timeline and simplified the layout and hierarchy.
SHOWING THE MATH ON DEMAND
Users wanted to understand how their net worth was calculated, so I added a “How was this calculated?” link under the projection. The main view stayed simple, and the math was there for anyone who wanted it.
CLARITY OVER PRECISION
I encouraged users to keep going even if they didn’t know exact amounts, and focused instead on making each question easy to understand, so the experience stayed approachable instead of stalling on exact numbers.
Constraints
Balancing clarity with complex financial data required simplifying what was shown without losing meaning. Some edge cases and deeper modeling were deferred to keep the experience usable and performant.
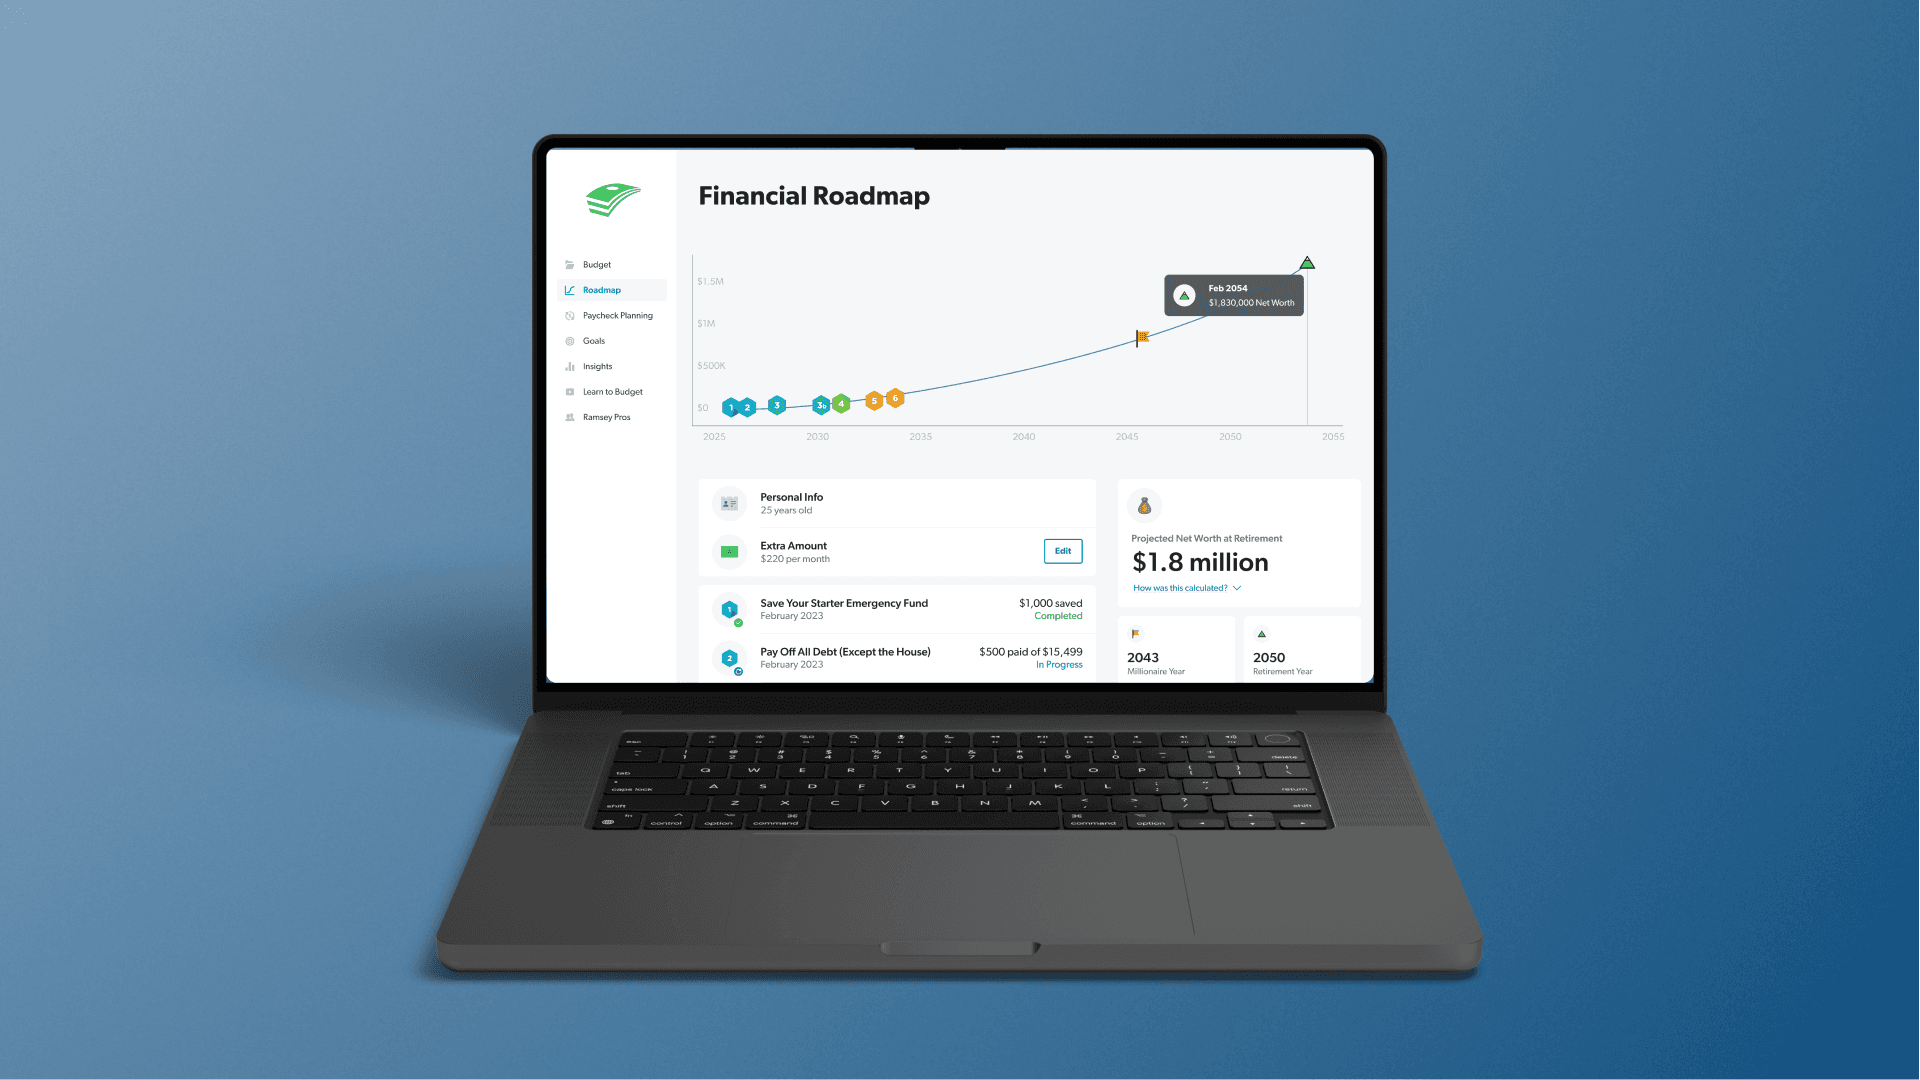
Projecting a user's journey in Financial Roadmap on web
What Changed
Users could clearly see how their financial decisions impacted long-term outcomes, making it easier to stay engaged and adjust plans over time. Trial start rate rose 10%, a $120K revenue impact.
Hindsight
Future improvements could include deeper scenario modeling and more personalized recommendations based on user behavior.
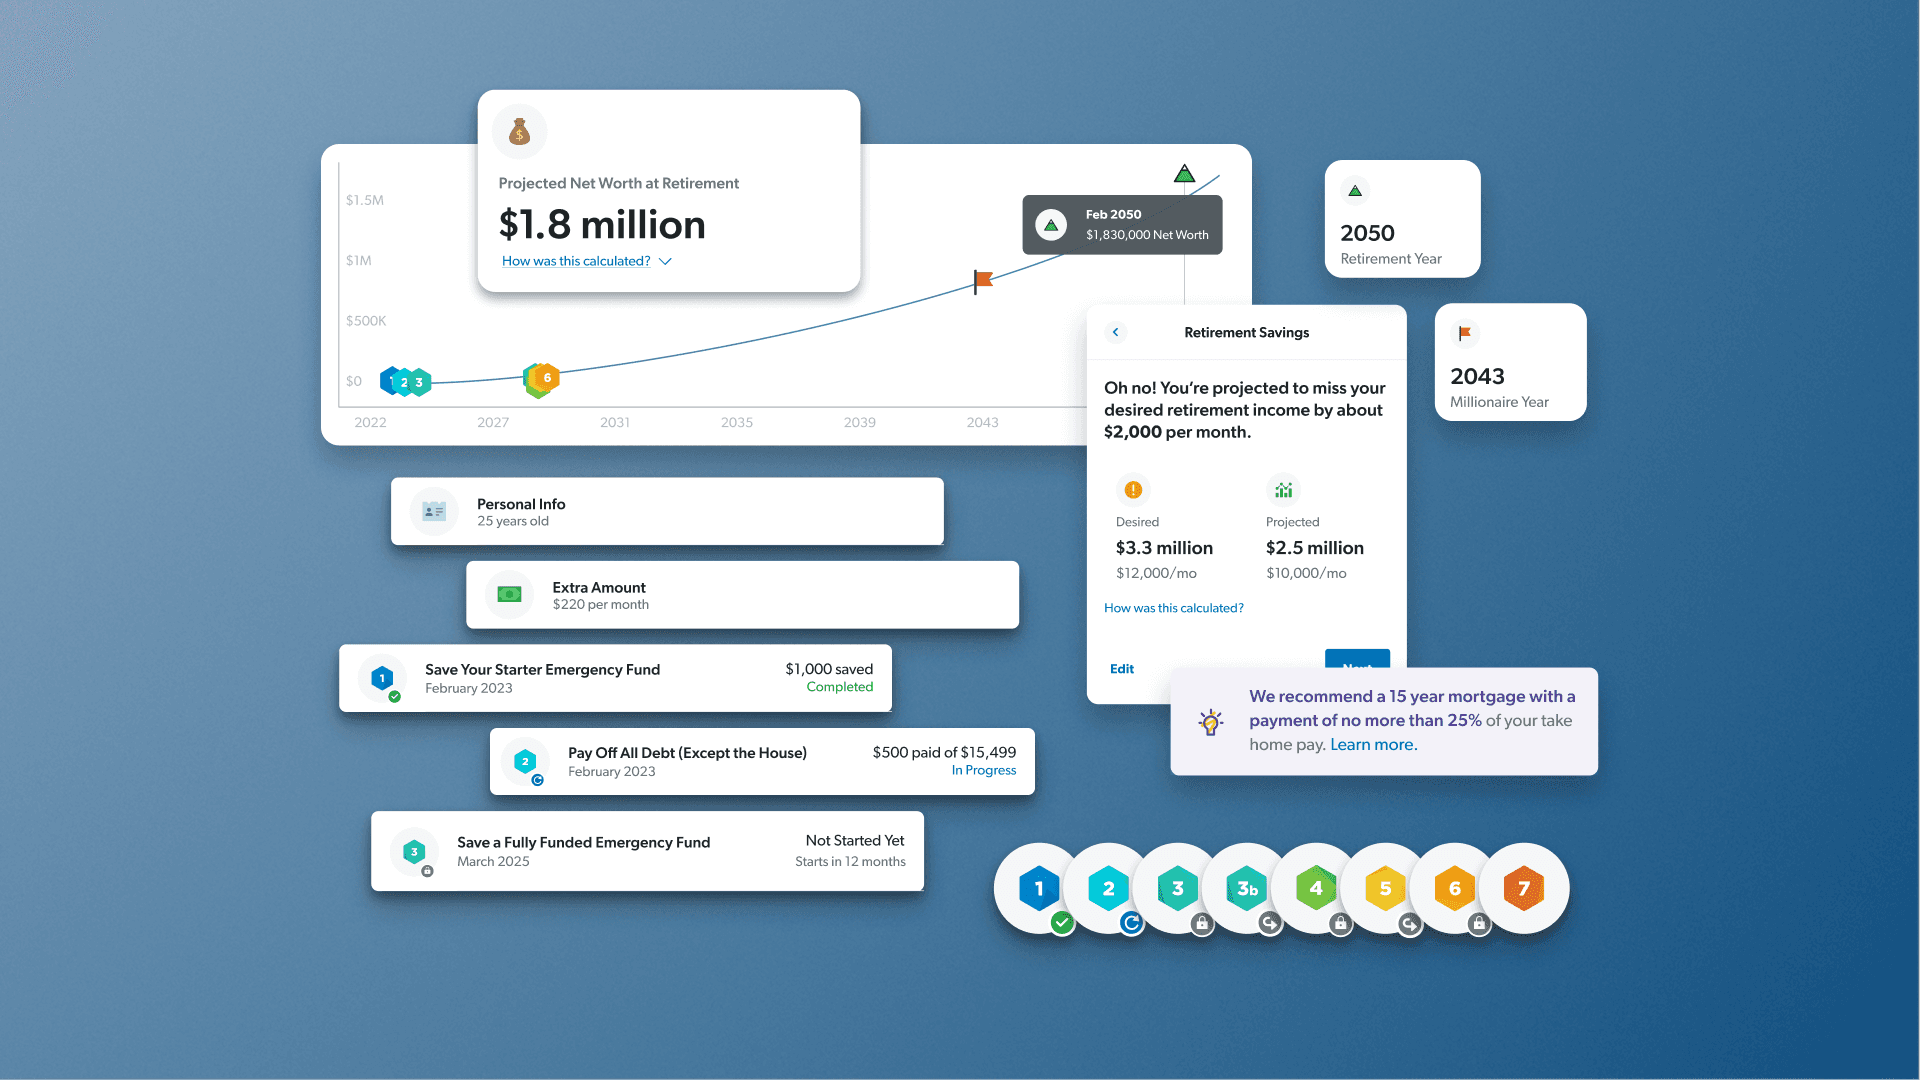
Components of Financial Roadmap